
Article
How to Read a Career Readiness Report
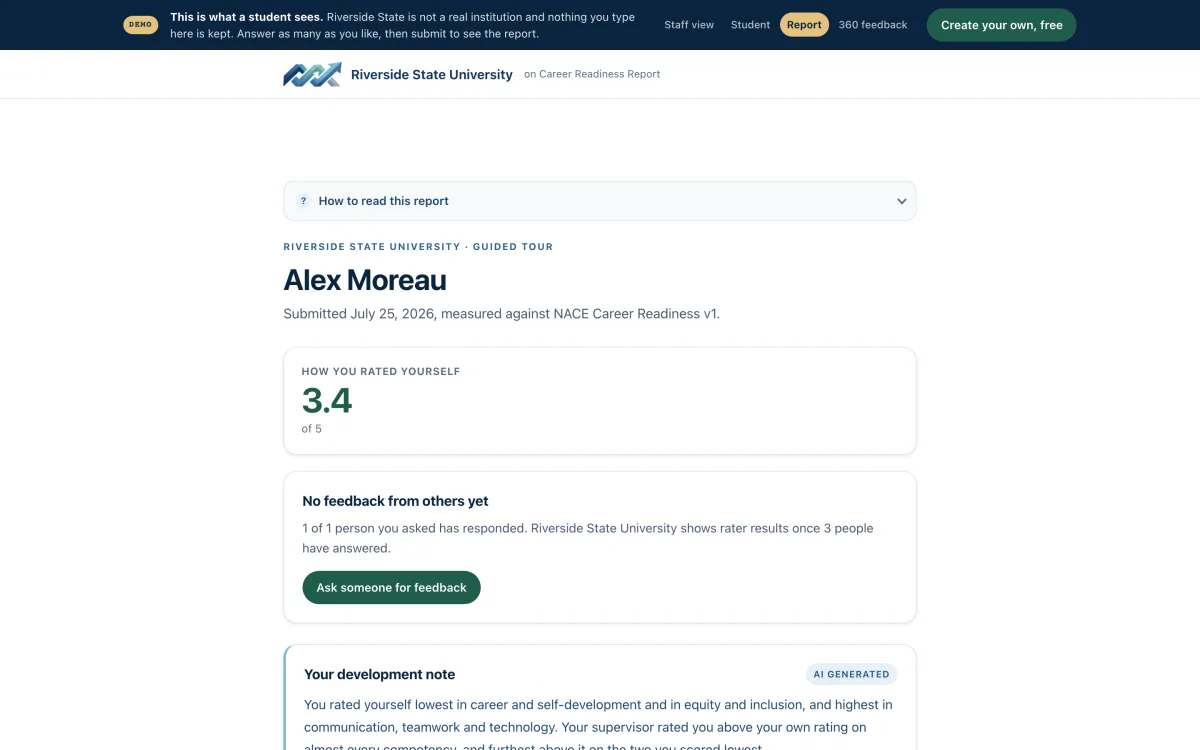
Read a career readiness report from the bottom up, not the top down. Start with the rater-level detail, move to the per-competency scores, and treat the overall composite as a label rather than a finding. The overall number is an average of averages: it compresses eight distinct competencies, two or three rater perspectives, and a variable number of answered items into a single digit that cannot tell you what to do next. The per-competency spread, meaning the gap between a student's highest and lowest competency and the gap between self-rating and supervisor rating within each one, is where the actionable information lives.
The overall picture, and its limits
Most reports open with a composite figure, often on a 1 to 5 scale. A 3.8 overall looks reassuring. It also describes a student rated 4.6 on Teamwork and 2.4 on Professionalism just as accurately as it describes a student rated 3.8 on everything. Those two students need entirely different conversations, and the composite hides which one you are looking at.
The composite is useful for exactly two purposes. First, sorting: if you have 400 internship reports and 90 minutes, ranking by composite gets you to the bottom decile fast. Second, longitudinal trend at the cohort level, where individual variance washes out and a shift from 3.4 to 3.6 across three years of business majors may mean something real about curriculum changes.
It is not useful for advising an individual student, for making a placement decision, or for anything you plan to write into an assessment report. If a reviewer asks what the 3.8 represents, the honest answer is "eight competencies averaged together," and that answer tends to end the line of questioning unhelpfully.
The per-competency breakdown
This is the heart of the report. You are looking at eight NACE competencies (Career and Self-Development, Communication, Critical Thinking, Equity and Inclusion, Leadership, Professionalism, Teamwork, Technology), each with a score and, in a 360 design, separate scores from the student and from each supervisor or faculty rater.
Three patterns are worth learning to recognize on sight.
The flat profile
All eight competencies within a few tenths of each other. This usually means one of two things: a genuinely consistent performer, or a rater who moved down the form quickly without differentiating. Check the rater-level detail. If a single supervisor gave 4s across all eight items in under two minutes, you are looking at response style, not performance. Flat profiles from multiple independent raters are more credible.
The wide profile
A gap of 1.5 points or more between the student's strongest and weakest competency. This is the most useful pattern in the report because it points directly at a coaching target. A student rated 4.5 on Critical Thinking and 2.5 on Communication has a specific, teachable problem, and the supervisor comments attached to the Communication items usually name it.
The self-supervisor divergence
When a student rates themselves 4.5 on Professionalism and the supervisor rates them 2.8, the number that matters is the 1.7 gap, not either score. Overrating tends to concentrate in Professionalism, Leadership, and Communication, which are the competencies students have the least external feedback on before their first supervised work experience. Underrating happens too, more often among first-generation students and in Technology, and it deserves the same attention: a student who cannot see a strength will not claim it in an interview.
One caution on divergence. A large gap on a single item from a single rater is noise. A consistent pattern across three or four items within the same competency is signal. Do not build a coaching conversation on one data point.
The rater-by-rater detail
Underneath the competency scores, a well-built report shows you who said what. Read this section before you trust anything above it.
Check the number of raters. Two supervisor ratings plus a self-assessment is a workable minimum. One supervisor rating is a single person's opinion, which may be entirely correct but should not be reported as a measurement.
Check rater agreement. When two supervisors of the same student diverge by more than a point on the same competency, something structural is going on: they saw different work, they hold different standards, or the competency was not observable in the role. Faculty and employer raters diverge routinely on Critical Thinking, because faculty are grading reasoning they can see in writing and employers are grading decisions they saw made under time pressure. Neither is wrong. Report both.
Check completion. A rater who answered 12 of 32 items has told you something about 12 items and nothing about the other 20.
Skipped items: exclude, do not zero
A skipped item means the rater could not observe the behavior. Scoring it as zero converts "I don't know" into "performed terribly," which is a substantive falsification of the record.
The correct handling is to exclude skipped items from the denominator and report the count. A competency scored on three of five items reads as "3.9 (3 of 5 items rated)" and the reader can judge for themselves. A competency where fewer than half the items were answered should not produce a competency score at all. Report it as insufficient data.
This matters more than it sounds. Equity and Inclusion and Leadership carry the highest skip rates in most internship contexts, because plenty of legitimate roles give a student no occasion to lead anyone or to navigate a cross-cultural conflict. If your platform zero-fills, those two competencies will appear as systematic cohort weaknesses in every report you produce, and you will end up designing an intervention for a measurement artifact. When we built the 360 instrument behind the Career Readiness Report, excluding unrated items rather than zeroing them changed cohort-level Leadership means by roughly half a point in pilot data.
Reading a cohort report
At the cohort level, the questions change. Look at the distribution, not the mean: a cohort mean of 3.5 on Communication could be a tight cluster or a bimodal split between strong and struggling students, and only the second calls for a targeted intervention. Look at which competencies have the widest self-supervisor gaps, because that tells you where your students' self-perception is least calibrated and where pre-internship instruction has the most room to work. And look at skip rates by competency and by placement site, which will tell you honestly which competencies your placements actually exercise.
The Career Readiness Report is free for every college and university. Open now, in beta.
Create your institution